
Aayush Jindal
Key Highlights
- Bitcoin started a fresh upside from the $80,000 pivot level.
- A key bearish trend line has formed with resistance at $83,800 on the 4-hour chart.
- Ethereum started a consolidation phase below the $2,500 resistance.
- Gold prices might gain traction if there is a close above $4,220.
Bitcoin Price Technical Analysis
Bitcoin price remained supported above $80,000 against the US Dollar. BTC started a fresh upward move and climbed above $81,200.
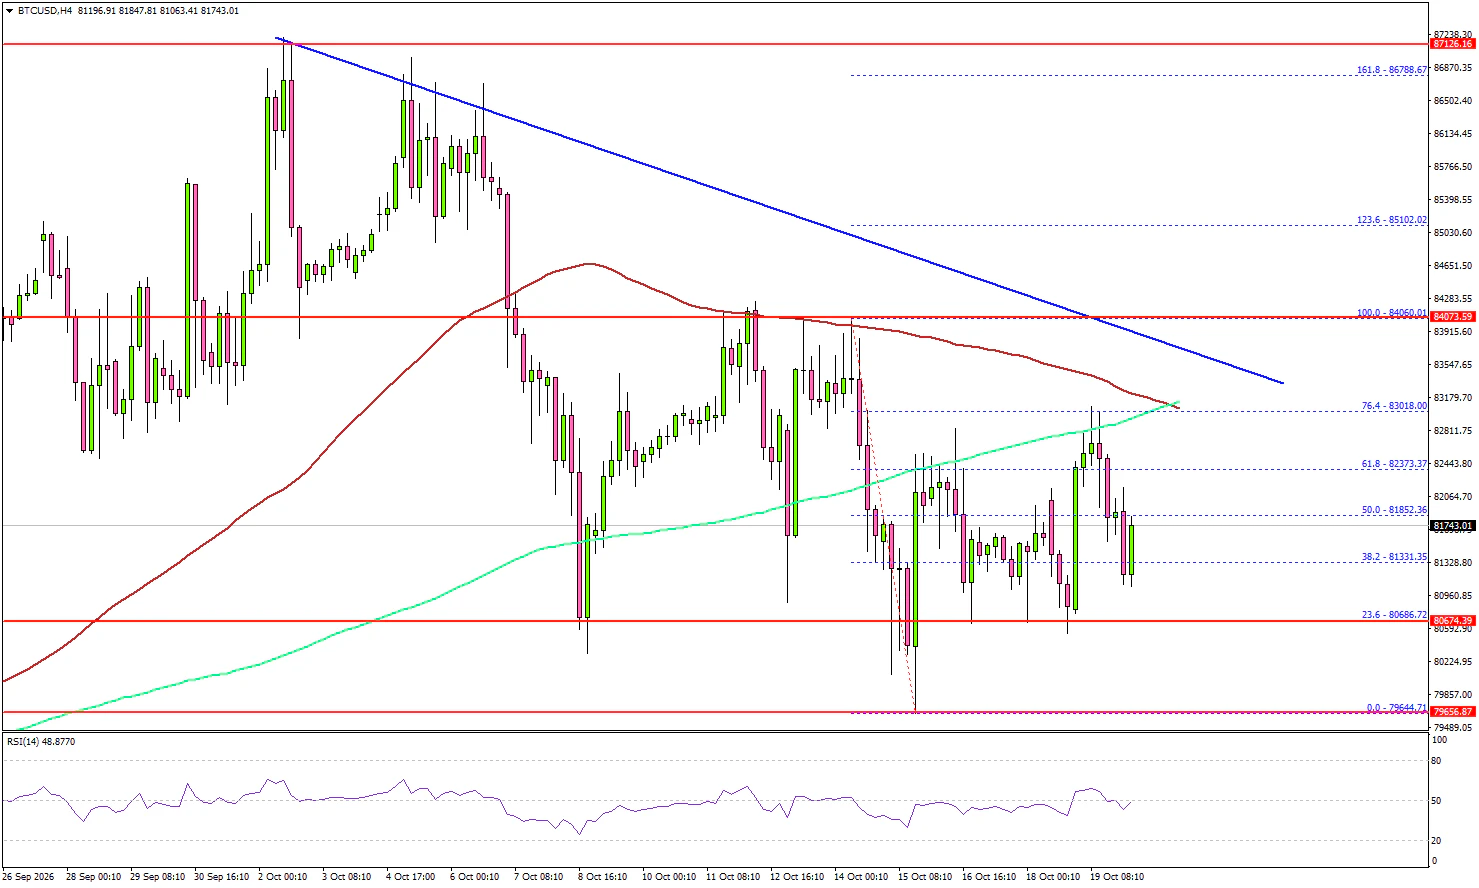
Looking at the 4-hour chart, the price was able to surpass the 61.8% Fib retracement level of the downward move from the $84,060 swing high to the $79,644 low. However, BTC faced resistance near a major confluence area of the 100 simple moving average (red, 4-hour) and the 200 simple moving average (green, 4-hour) at $83,000 and the 76.4% Fib level.
The first major resistance might be $83,800. There is also a key bearish trend line formed with resistance at $83,800. A close above $83,800 could start another steady increase. In the stated case, the bulls could aim for a move to $85,000. Any further gain might call for a test of $86,500.
If there is a fresh decline, the pair might find bids near the $80,800 level. The first major support could be $80,000. A downside break and close below $80,000 could trigger a sharp decline. In the stated scenario, the price could test $77,800.
Looking at Ethereum, the price remained in a range and might struggle to settle above the $2,500 resistance zone in the near term.
Today’s Key Economic Releases
- US Housing Starts for Sep 2026 (MoM) – Forecast 1.310M, versus 1.275M previous.
- US Building Permits for Sep 2026 (MoM) – Forecast 1.40M, versus 1.403M previous.
- US ADP Employment Change 4-week Average - Forecast 18K, versus 24.75K previous.

