
Aayush Jindal
Key Highlights
- Bitcoin failed to surpass $65,000 and trimmed some gains.
- BTC/USD traded below a contracting triangle with support at $62,500 on the 4-hour chart.
- Ethereum also struggled above $1,800 and dipped from resistance.
- The US CPI could increase by 3.8% in June 2026 (YoY).
Bitcoin Price Technical Analysis
Bitcoin price attempted to gain pace for a move above $64,500 against the US Dollar but failed. BTC trimmed some gains and signaled a downside break.
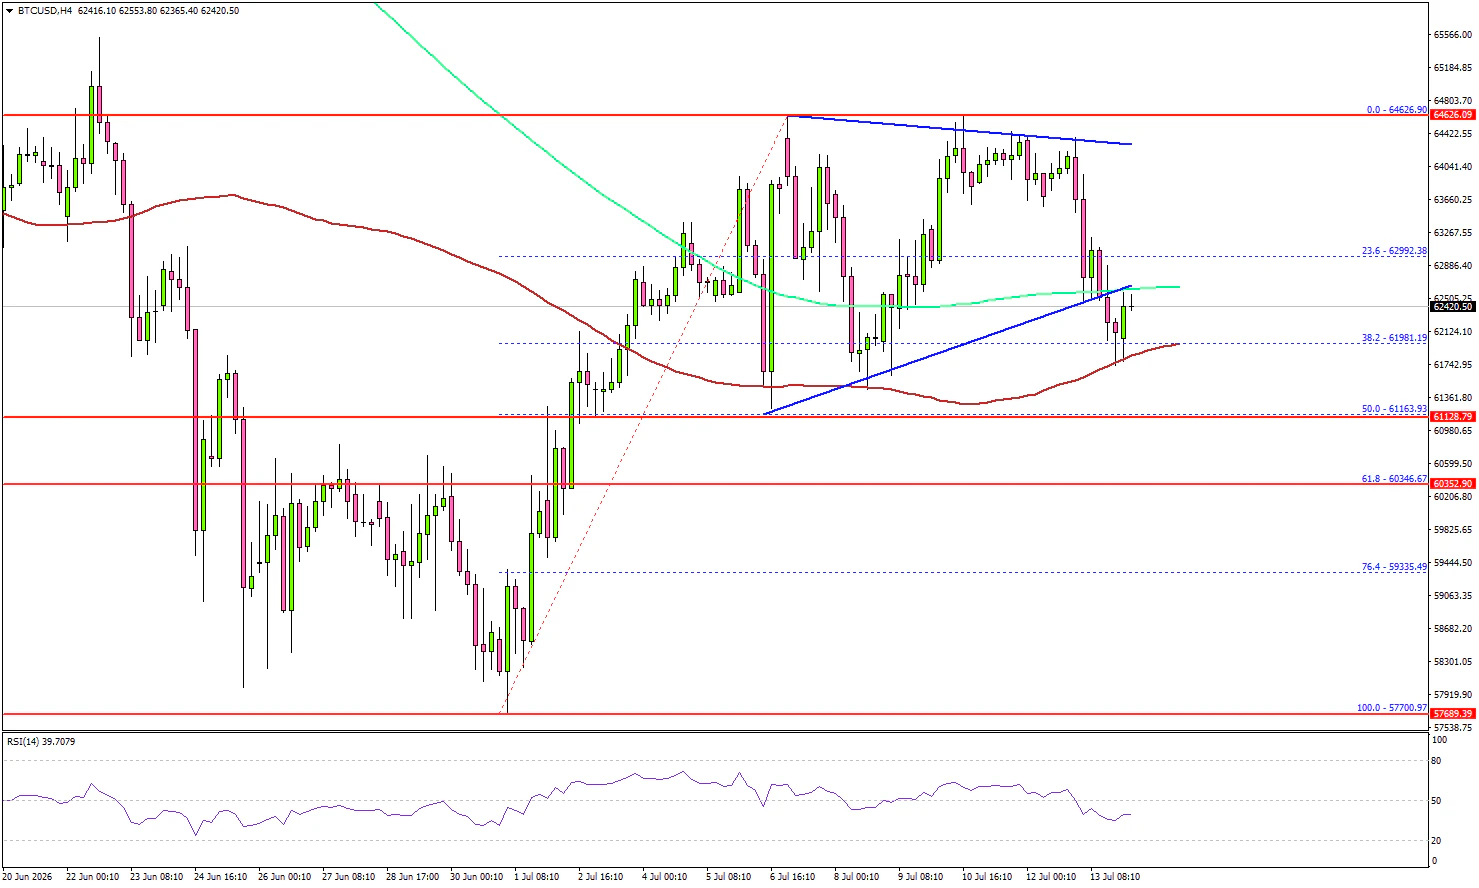
Looking at the 4-hour chart, the price formed a high near $64,626 and started a downside correction. There was a move below $63,500 and $63,200. The price traded below the 23.6% Fib retracement level of the upward move from the $57,700 swing low to the $64,626 high.
More importantly, BTC traded below a contracting triangle with support at $62,500 and the 200 simple moving average (green, 4-hour). If the bears remain in action, the price might find bids near the 50% Fib retracement level at $61,150.
A downside break and close below $61,150 could trigger a sharp decline. In the stated scenario, the price could test $60,350 or even $58,800.
On the upside, an immediate resistance could be $63,800. The first major resistance might be $64,500. The main resistance might be $65,000. A close above $65,000 could send the price toward $66,800. Any more gain might call for a test of $68,000.
Looking at Ethereum, the price seems to be facing a tough hurdle near $1,825 and might start a fresh decline in the near term.
Today’s Key Economic Releases
- US Consumer Price Index for June 2026 (MoM) – Forecast -0.1%, versus +0.5% previous.
- US Consumer Price Index for June 2026 (YoY) – Forecast +3.8%, versus +4.2% previous.
- US Consumer Price Index Ex Food & Energy for June 2026 (YoY) – Forecast +2.9%, versus +2.9% previous.
- Fed Chair Warsh testifies.
- Fed's Barr speech.
- Fed's Goolsbee speech.
- Fed's Cook speech.