
Aayush Jindal
Key Highlights
- Ethereum started a fresh surge above the $2,000 resistance.
- It surged over 20% and even tested the $2,300 resistance on the 4-hour chart of ETH/USD.
- Bitcoin price also started a decent increase above the $66,650 resistance.
- XRP climbed higher after it formed a base above the $1.00 pivot zone.
Ethereum Technical Analysis
Ethereum started a fresh increase from $1,850 against the US Dollar. ETH/USD climbed above $1,950 to enter a short-term positive zone.
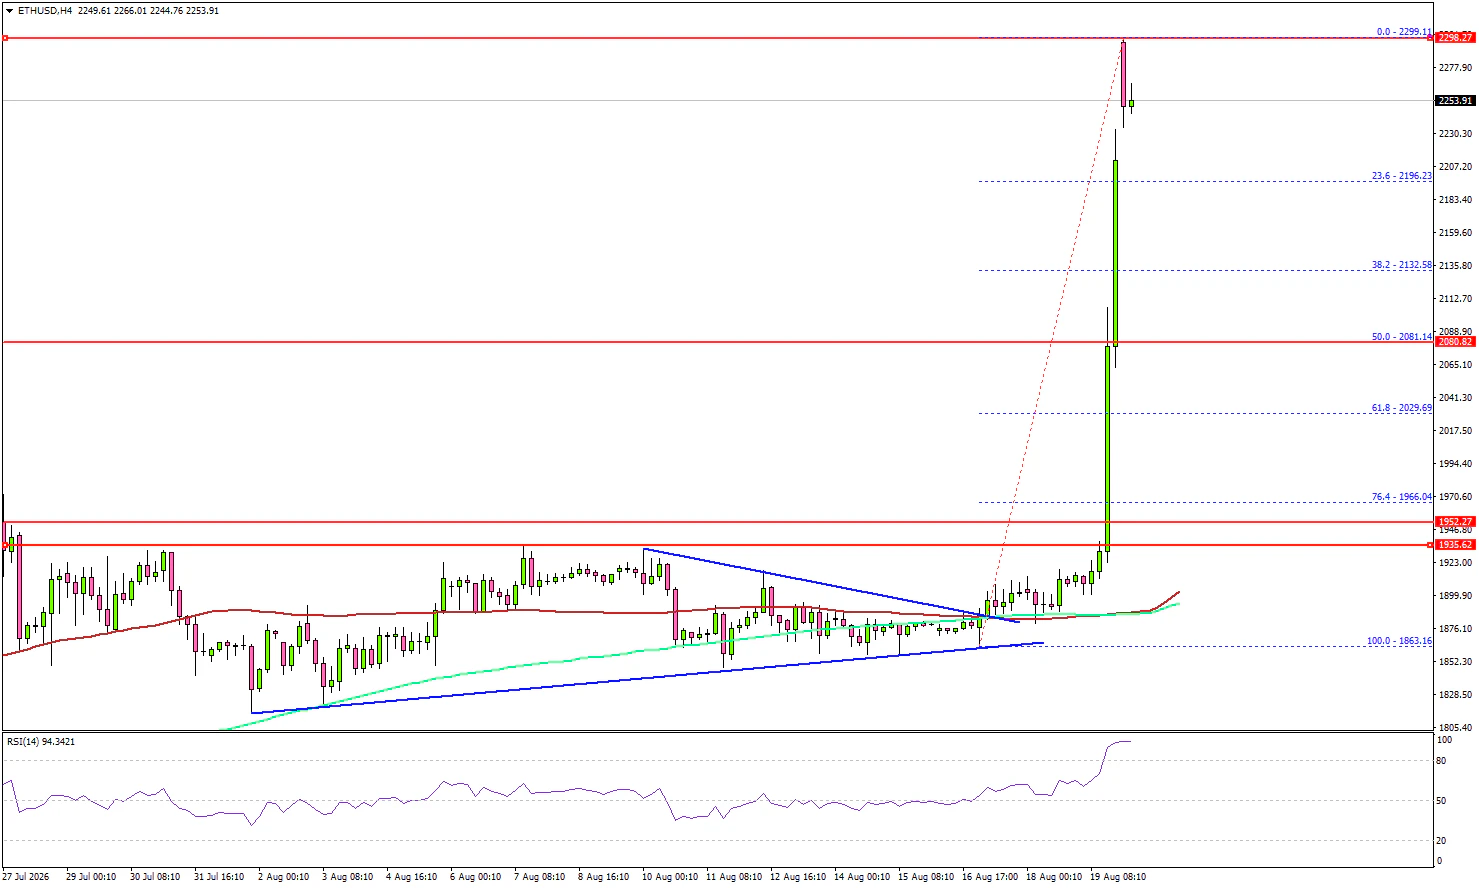
Looking at the 4-hour chart, the price cleared a key contracting triangle with resistance at $1,880. Besides, there was a close above $2,050, the 100 simple moving average (red, 4-hour), and the 200 simple moving average (green, 4-hour).
The bulls pumped the price over 20%, and the price traded close to the $2,300 resistance on TitanFX. On the upside, the bears might remain active near $2,280 and $2,300.
The first key resistance could be near the $2,320 level. The main hurdle for bulls sits near $2,350. A close above the $2,350 level could open doors for a larger upward movement. In the stated case, ETH could rise toward $2,500.
On the downside, the bulls might be active near $2,220 and $2,000. The first major support might be $2,080 and the 23.6% Fib retracement level of the upward move from the $1,863 swing low to the $2,299 high. Any more losses might call for a move toward $2,020. The main support could be $1,950.
Looking at Bitcoin, the price started a steady increase, and the bulls might aim for a move above the $70,000 resistance.
Economic Releases
- US Initial Jobless Claims - Forecast 210K, versus 209K previous.
- Philadelphia Fed Manufacturing Survey for August 2026 – Forecast 25.0, versus 41.4 previous.