
Aayush Jindal
Key Highlights
- GBP/USD failed to surpass 1.3675 and started a downside correction.
- It traded below a major bullish trend line with support at 1.3570 on the 4-hour chart.
- WTI Crude Oil prices started a fresh surge and surpassed $88.00.
- EUR/USD started consolidating losses above the 1.1550 support.
EUR/USD Technical Analysis
The British Pound struggled near 1.3675 and dipped against the US Dollar. GBP/USD traded below 1.3620 and 1.3600 to enter a short-term bearish zone.
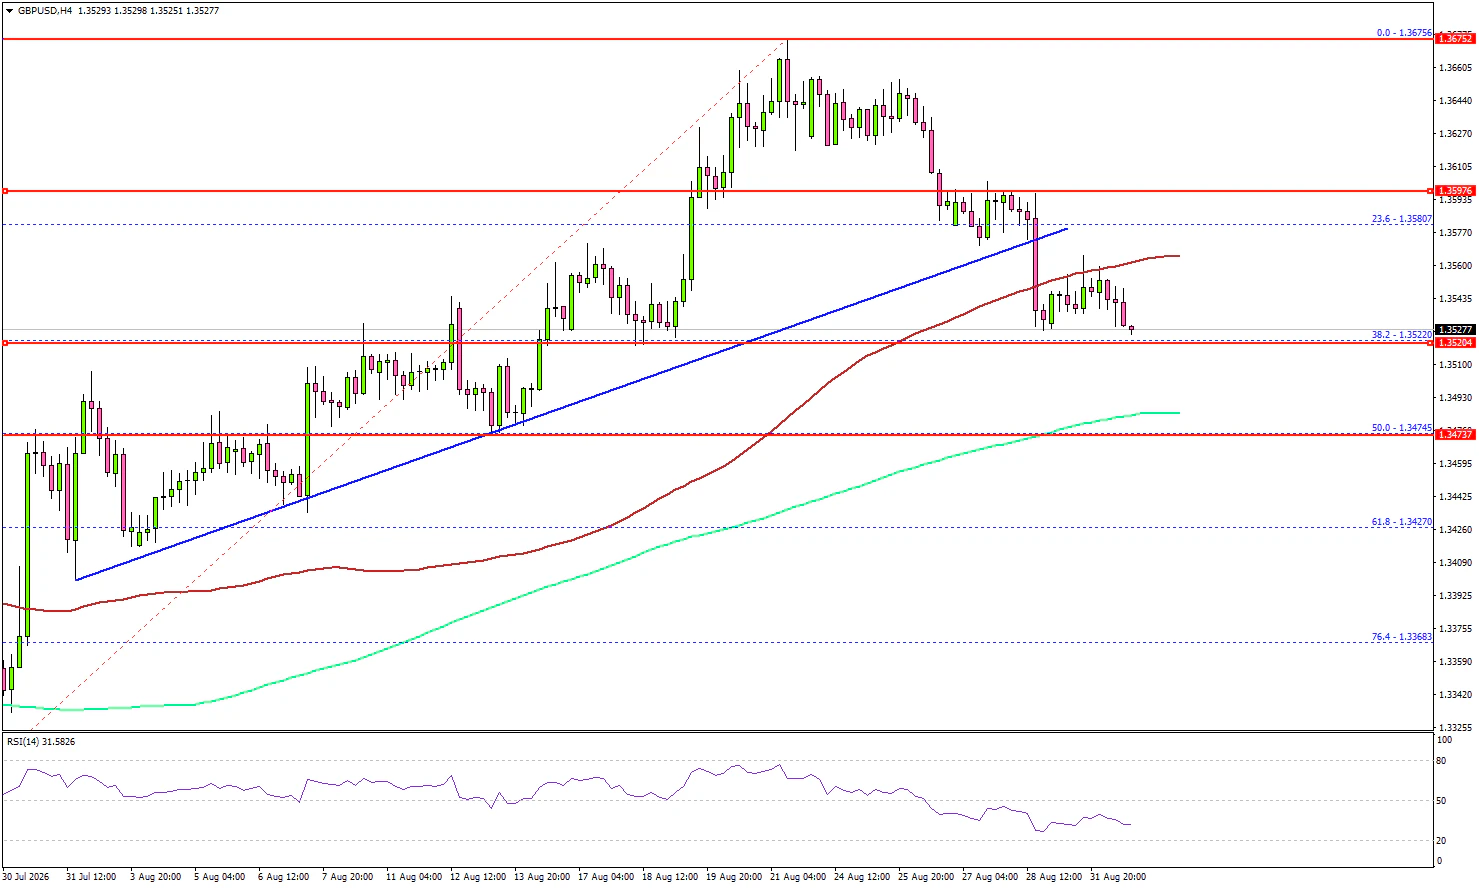
Looking at the 4-hour chart, the pair traded below a major bullish trend line with support at 1.3570. The bears pushed the pair toward the 38.2% Fib retracement level of the upward move from the 1.3273 swing low to the 1.3675 high.
The pair even settled below the 100 simple moving average (red, 4-hour). If there are more losses, the pair might find bids near 1.3520.
The first major support could be near 1.3480 and the 200 simple moving average (green, 4-hour) or the 50% Fib retracement level. A downside break and close below 1.3480 might start a major leg down. In the stated case, the bears could aim for a move to 1.3425. Any more losses could open the door for a test of 1.3350.
On the upside, GBP/USD could face resistance near the 1.3580 level. The next major resistance might be 1.3600. A close above 1.3600 could start another steady increase. In the stated case, the bulls could aim for a move to 1.3620. Any further gains might open the door for a test of 1.3650.
Looking at WTI Crude Oil prices, the price gained bullish pace, and the bulls could now aim for a move toward the $92.00 level.
Upcoming Key Economic Events:
- Fed's Beige Book.
- US ADP Employment Change for August 2026 - Forecast 48K, versus 44K previous.