
Aayush Jindal
Key Highlights
- WTI Crude Oil started a recovery wave from the $88.50 support.
- XTI/USD surpassed a few key hurdles near $94.20 on the 4-hour chart.
- EUR/USD started another decline and traded to a new multi-week low below 1.1150.
- USD/JPY could eye an upside break above 160.00.
WTI Crude Oil Price Technical Analysis
WTI Crude Oil prices remained supported above $88.00 against the US Dollar. The price formed a base and started a recovery wave above $90.00.
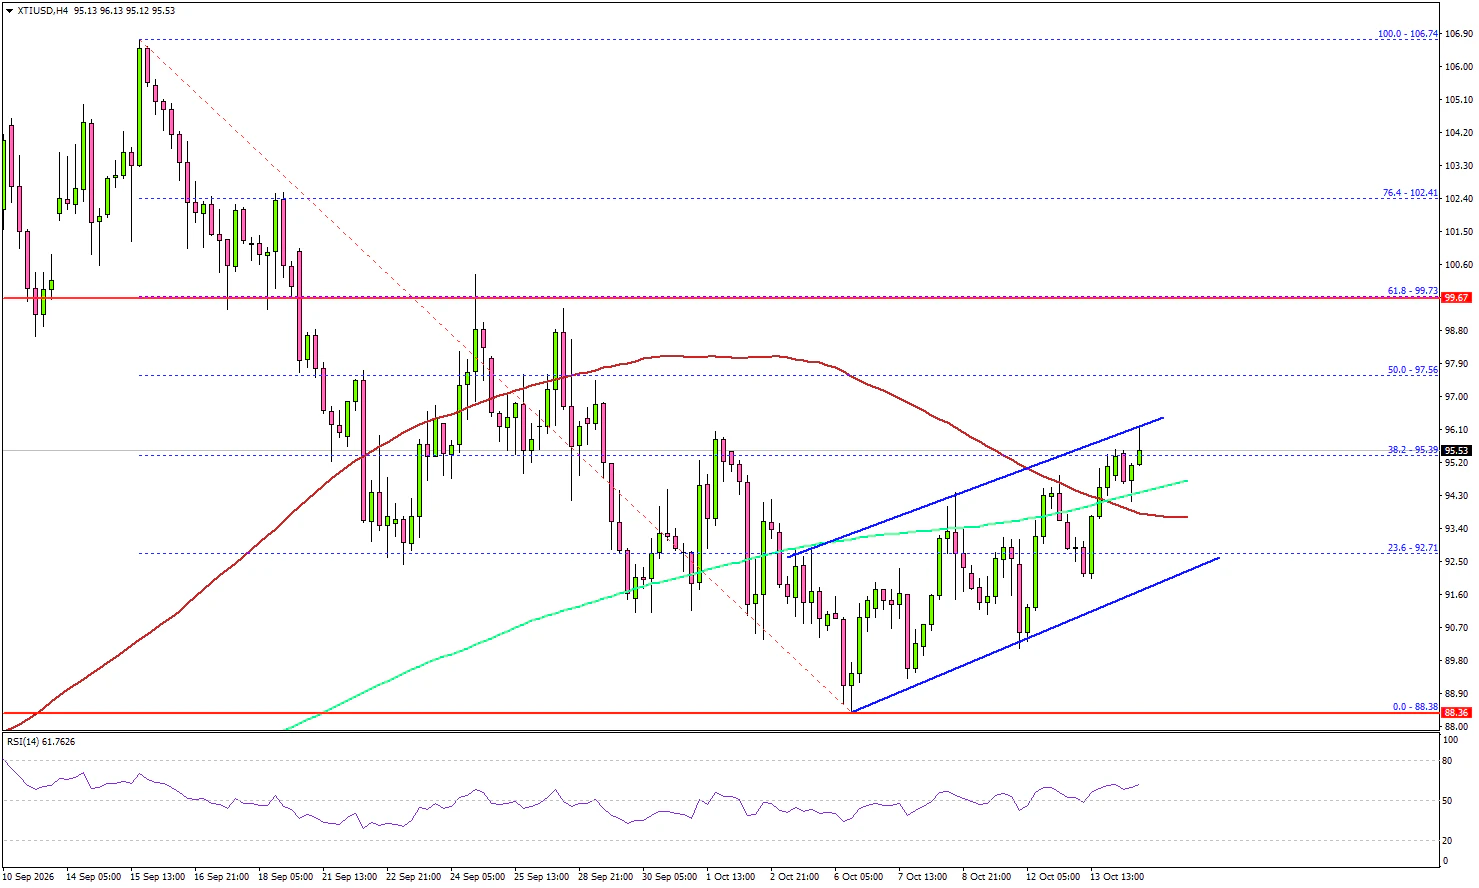
Looking at the 4-hour chart of XTI/USD, the price surpassed the 23.6% Fib retracement level of the downward move from the $106.74 swing high to the $88.38 low. There was a close above $94.00, the 100 simple moving average (red, 4-hour), and the 200 simple moving average (green, 4-hour).
On the upside, the price could face resistance at $97.50. The first major resistance sits at $99.75 or the 61.8% Fib retracement. A close above $99.75 could send Oil prices toward $102.40. Any more gains could open the doors for a move to $105.00.
If there is a fresh pullback, the price might even test the 100 simple moving average (red, 4-hour) at $94.20. The next support sits at $92.50. The main support could be $88.40. A close below $88.40 could initiate a move to $82.00 in the coming days.
Looking at EUR/USD, the bears remained in action, pushed the pair to a new multi-week low, and might aim for more downside.
Economic Releases to Watch Today
- US Initial Jobless Claims - Forecast 200K, versus 197K previous.
- US Producer Price Index for Sep 2026 (MoM) – Forecast +0.5%, versus +0.4% previous.
- US Producer Price Index for Sep 2026 (YoY) – Forecast +5.3%, versus +5.4% previous.
- US Retail Sales for Sep 2026 (MoM) – Forecast +0.3%, versus +1.2% previous.