
Aayush Jindal
Key Highlights
- WTI Crude Oil started a fresh surge above $90.00 and $91.20.
- A bullish trend line is forming with support at $87.50 on the 4-hour chart of XTI/USD.
- Gold started a consolidation phase below the $4,700 resistance.
- USD/JPY traded marginally above 160.00 before correcting some gains.
WTI Crude Oil Price Technical Analysis
WTI Crude Oil prices started a steady increase above $86.50 against the US Dollar. The price gained bullish momentum and even climbed above $90.00.
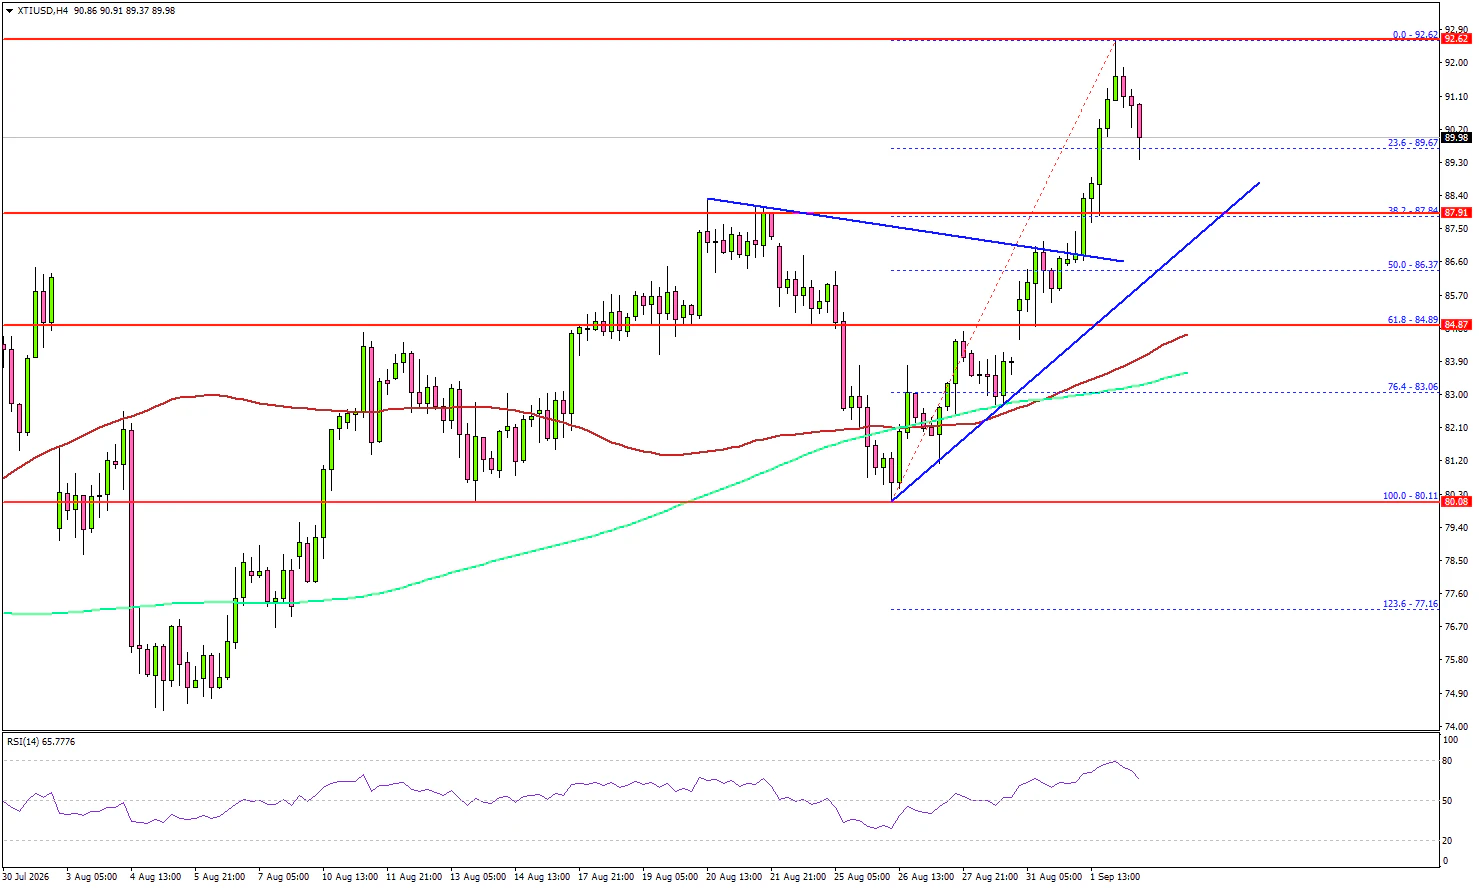
Looking at the 4-hour chart of XTI/USD, the price extended gains and settled above the 100 simple moving average (red, 4-hour) and the 200 simple moving average (green, 4-hour). A high was formed at $92.62 before the bears appeared.
There was a minor pullback below $91.20 and the 23.6% Fib retracement level of the upward move from the $80.11 swing low to the $92.622 high. If there are more losses, the price might find support at $87.80. There is also a bullish trend line forming with support at $87.50.
The first major support could be near the $85.00 zone since it is close to the 61.8% Fib retracement level and the 100 simple moving average (red, 4-hour). A close below $85.00 might even push the price toward $82.00. The next support might be $80.80.
On the upside, the price could face resistance at $92.50. The next resistance might be $93.40. The main hurdle for steady gains could be $95.00. A close above $95.00 could send Oil prices toward $98.00 or even $100.00.
Looking at USD/JPY, there was a steady increase, and the price climbed above 160.00 before the bears took a stand.
Economic Releases to Watch Today
- US Initial Jobless Claims - Forecast 205K, versus 203K previous.
- US S&P Global Services PMI for August 2026 – Forecast 56.8, versus 56.8 previous.
- US ISM Services PMI for August 2026 – Forecast 54.3, versus 54.1 previous.